
How do scientists know what we are thinking? Tools of the Cognitive Neuroscience Trade
13 Dec 2025

Cognitive neuroscience is the science of trying to understand how our brains enable our cognitive abilities, such as recognising visual objects, attending to a single sound, remembering a past holiday, and using language to communicate ideas. You probably know that our brains are full of cells called neurons. Different neurons respond to different inputs, often depending on where they reside within the brain, and send outputs to other connected neurons. Neurons in the visual cortex, for example, “light up” when you’re looking at something, whereas a scent activates neurons in the olfactory bulb, which can in turn trigger activity in connected neurons in the hippocampus, so as to retrieve a memory associated with that scent. But how do neuroscientists know this? They are not just going around opening brains and observing what happens, right? Luckily, no.
Advancements over the last few decades have led to non-invasive “brain scanning” techniques like MRI, EEG and MEG, which can record “images” of brain activity, often called “neuroimaging”. Cognitive neuroscientists can also temporarily alter the activity of neurons by using “neurostimulation” techniques like TMS. Finally, they can build computer models that mimic the brain’s architecture (“artificial neural networks”) and see whether these learn to perform tasks in the same way that human brains do. Below, we unpack some of these techniques, together with some of their pros and cons, using some light-hearted cartoons.
Please enjoy.
Functional Near-Infrared Spectroscopy (FNIRS)
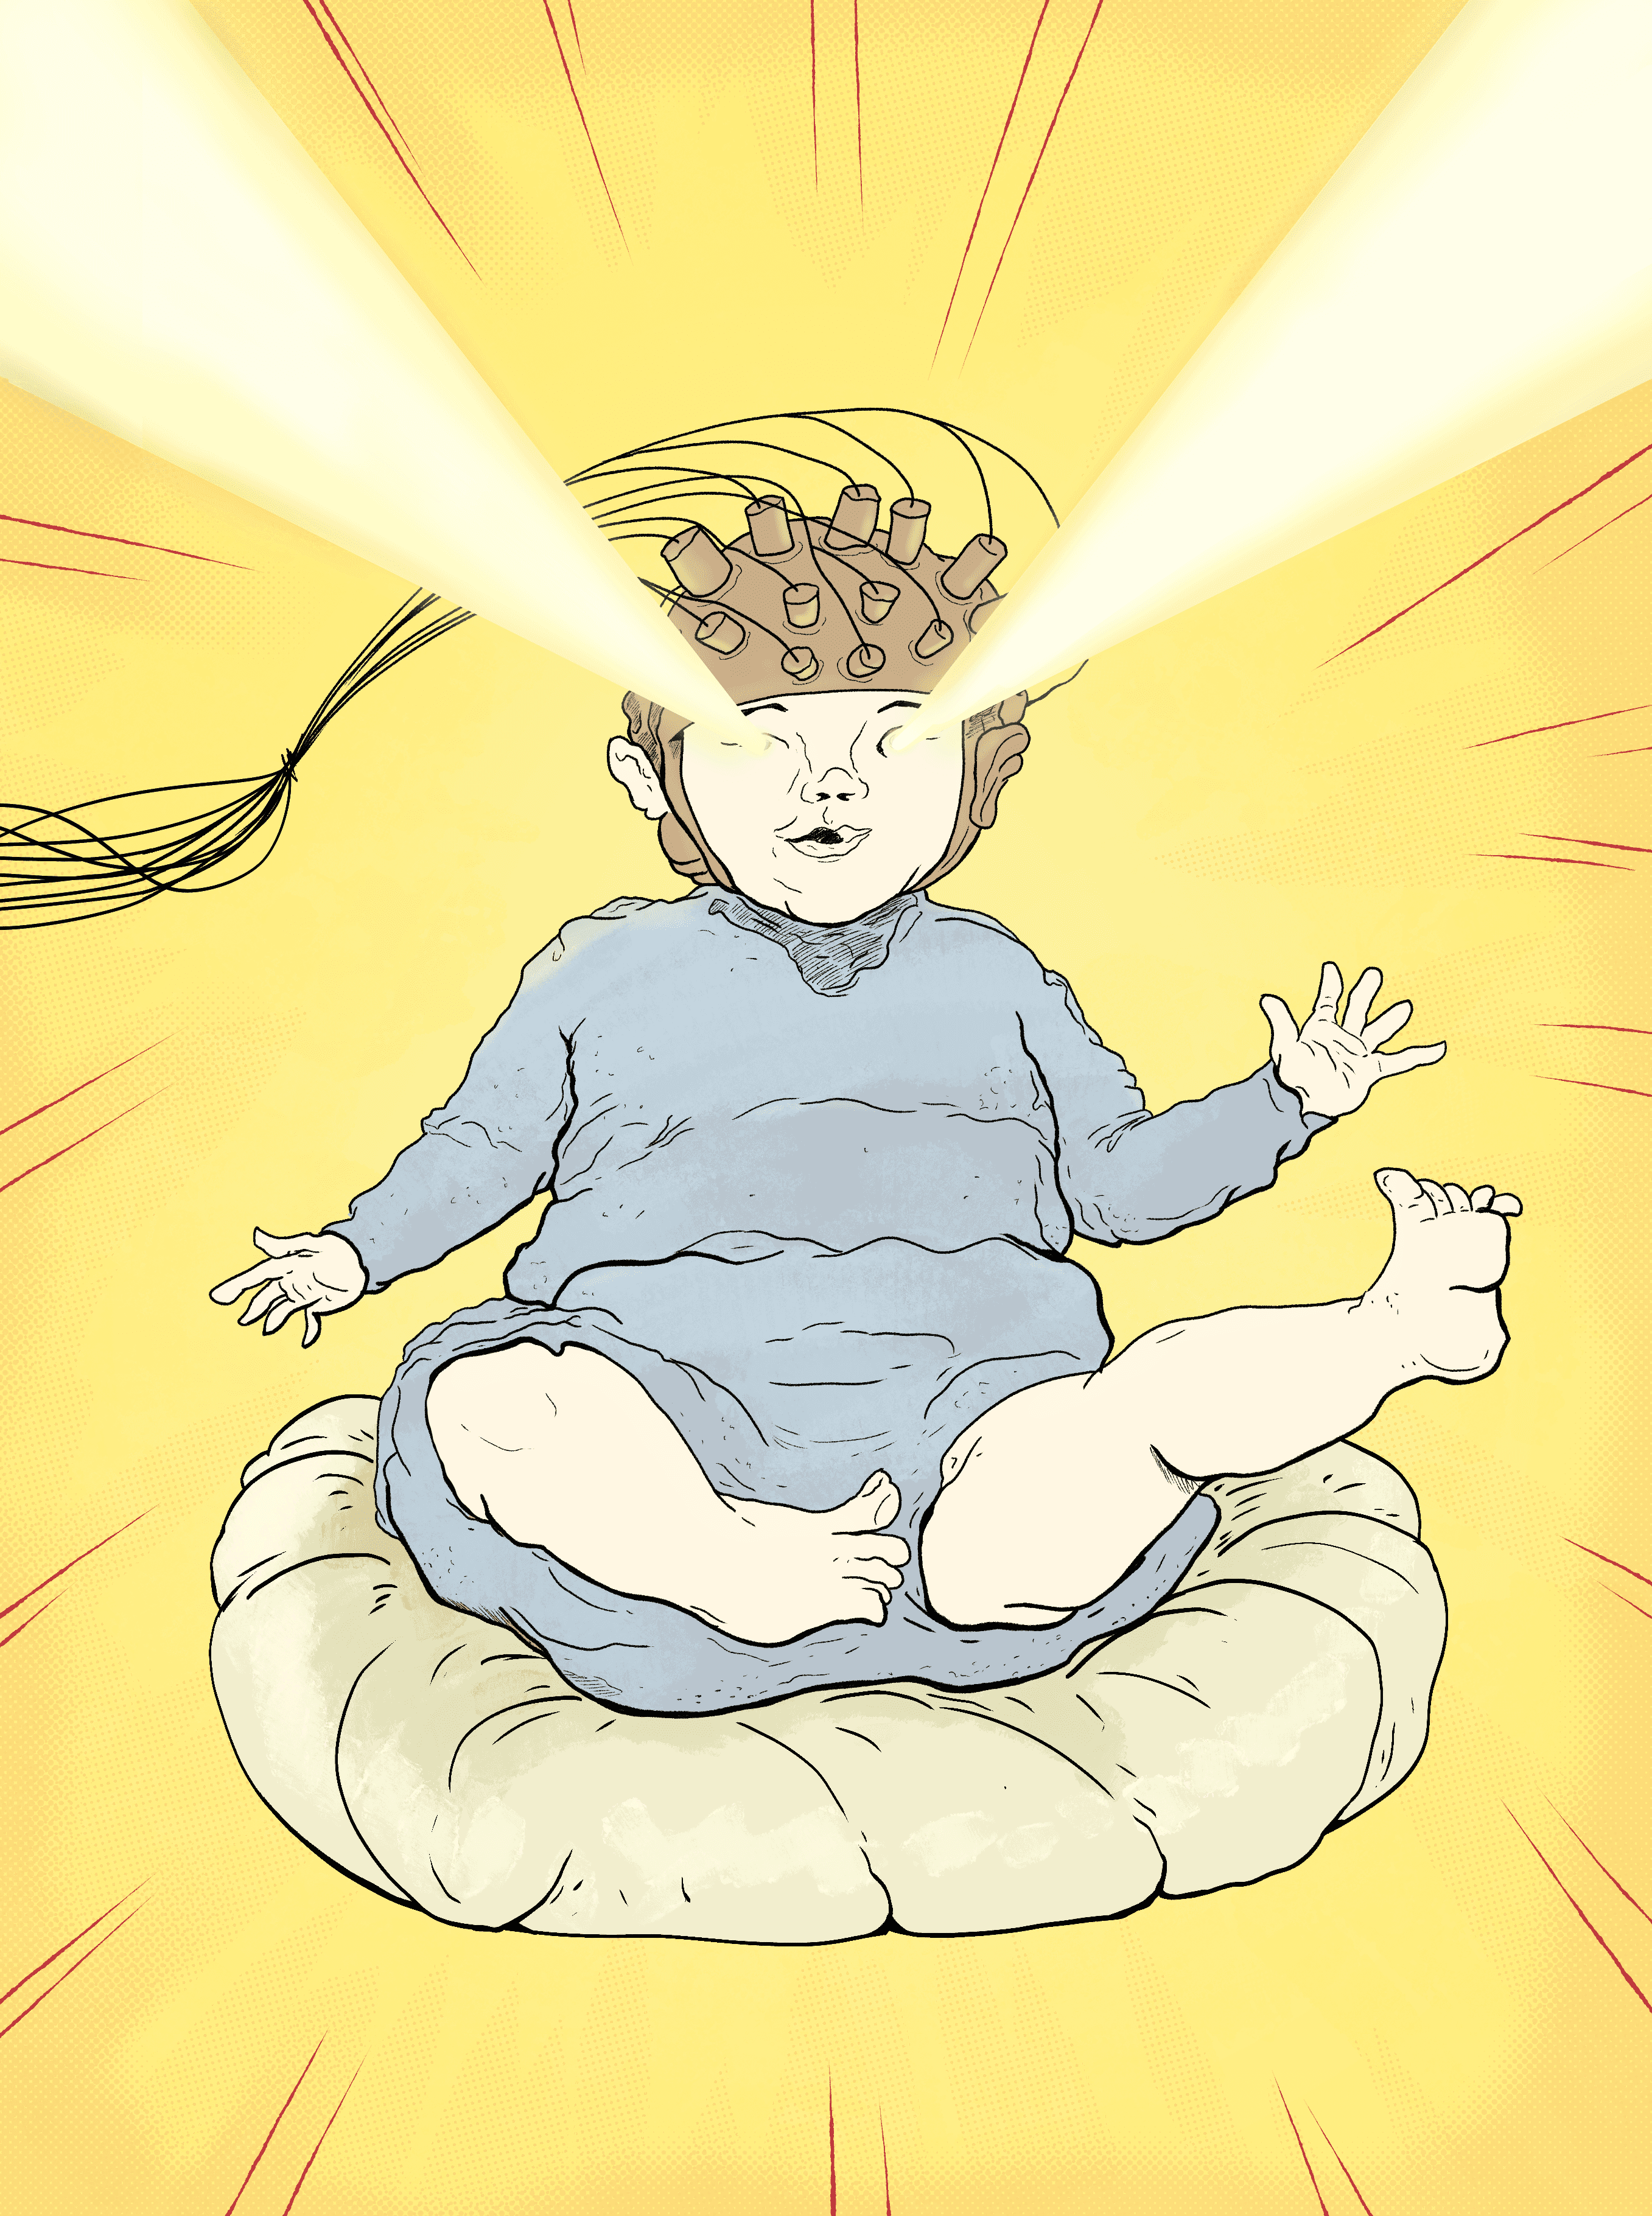
Functional Near-Infrared Spectroscopy, or FNIRS, is another technique that can be used to track changes in blood oxygenation in the brain. FNIRS uses infrared light that can pass through the skull, and is differentially absorbed by oxygenated versus deoxygenated haemoglobin in the blood. It can therefore track the metabolic consequences of neural activity, resulting in changes in the ratio of oxygenated versus deoxygenated blood in the brain, in a similar matter to fMRI above. FNIRS has the advantage that it does not use strong magnetic fields, so is cheaper and applicable to anyone (even if they have metal implants, which is a problem for MRI). This also makes it easier to use on populations like children, who are not always comfortable in an MRI scanner (or able to stay still, like the baby depicted above!) – and whose skulls tend to be thinner anyway, making FNIRs slightly more sensitive. Its disadvantage is that the light cannot pass too deeply into the brain, so only superficial regions of the brain (cortex) can be imaged. But contrary to the above cartoon, there is no real danger of the light emerging from other orifices!
——————————
Functional Magnetic Resonance Imaging (fMRI)
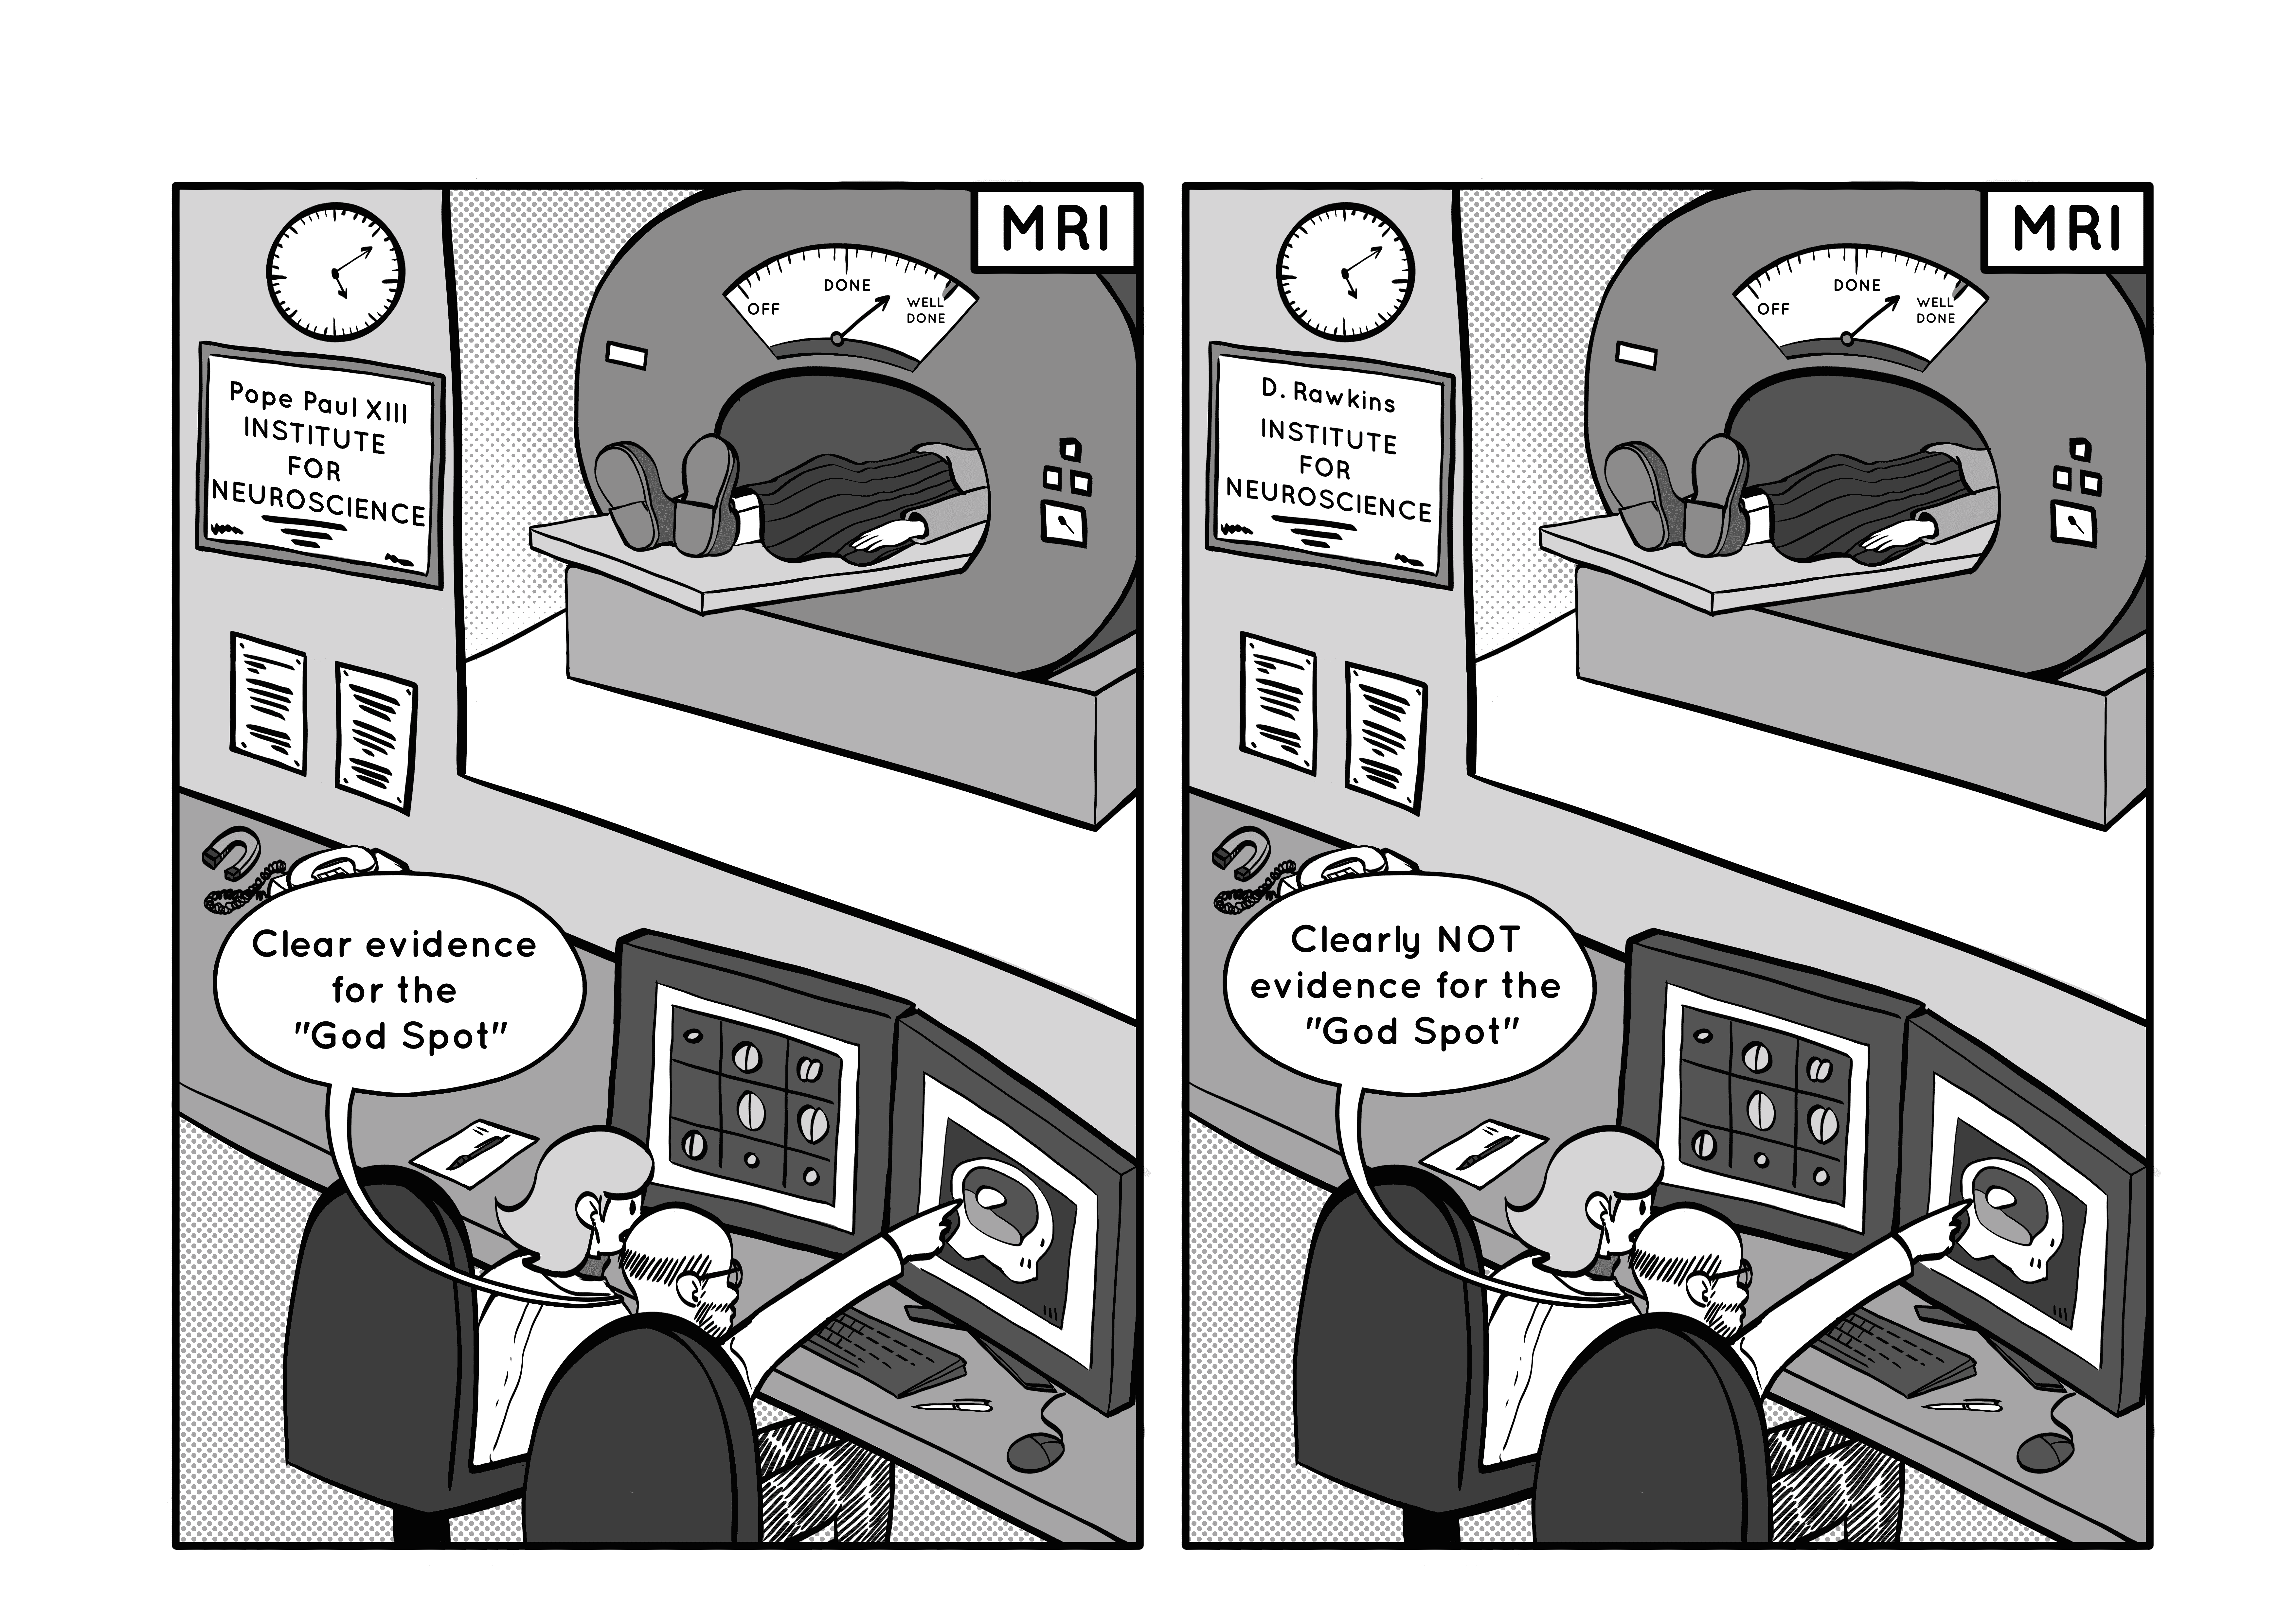
An MRI scanner is used routinely in hospitals to take pictures of internal parts of the body. MRI stands for “magnetic resonance imaging”, and is an incredibly flexible technology, owing to the fact that different molecules “resonate” (vibrate) at different frequencies when you apply a strong magnetic field. You can therefore tune an MRI scanner to detect concentrations of specific molecules in a body. For example, an MRI scanner can be tuned to the molecule “deoxyhaemoglobin”, which is produced by neurons in the brain when they are active (since they need oxygen to generate electrical activity). For example, neurons at the back of the brain (in the visual cortex) are more active when a picture is presented, and the concentration of deoxyhaemoglobin temporarily changes in that part of the brain as a consequence. This application of MRI is called “functional” MRI (fMRI), because cognitive neuroscientists can use it to map out the functions of different brain regions, by asking someone to lie in a scanner while what an experimenter controls what they see, hear, or are asked to think about.
However, not all functions are easily localised to single brain regions, and the reputation of fMRI has been tarnished by attempts to localise abstract concepts like “love” or “religion” (which are probably not primitive cognitive operations restricted to single brain regions) – reminding people of the discredited past research field of “phrenology”. Moreover, fMRI typically involves making thousands of statistical tests across each point (“voxel”) in an image, and failures to properly control for false positives have resulted in jokes about finding “activation” in the brain of a dead salmon that was put inside an MRI scanner for example. These two problematic aspects are illustrated by the cartoon above: different research groups with different statistical criteria and different theoretical frameworks (and possible different agendas, eg based on their funders!) interpret the same data in different ways. Nonetheless, fMRI can, and is, used to make important scientific inferences about what different parts of the brain “do” (for further reading, see here).
——————————
Transcranial Magnetic Stimulation (TMS)
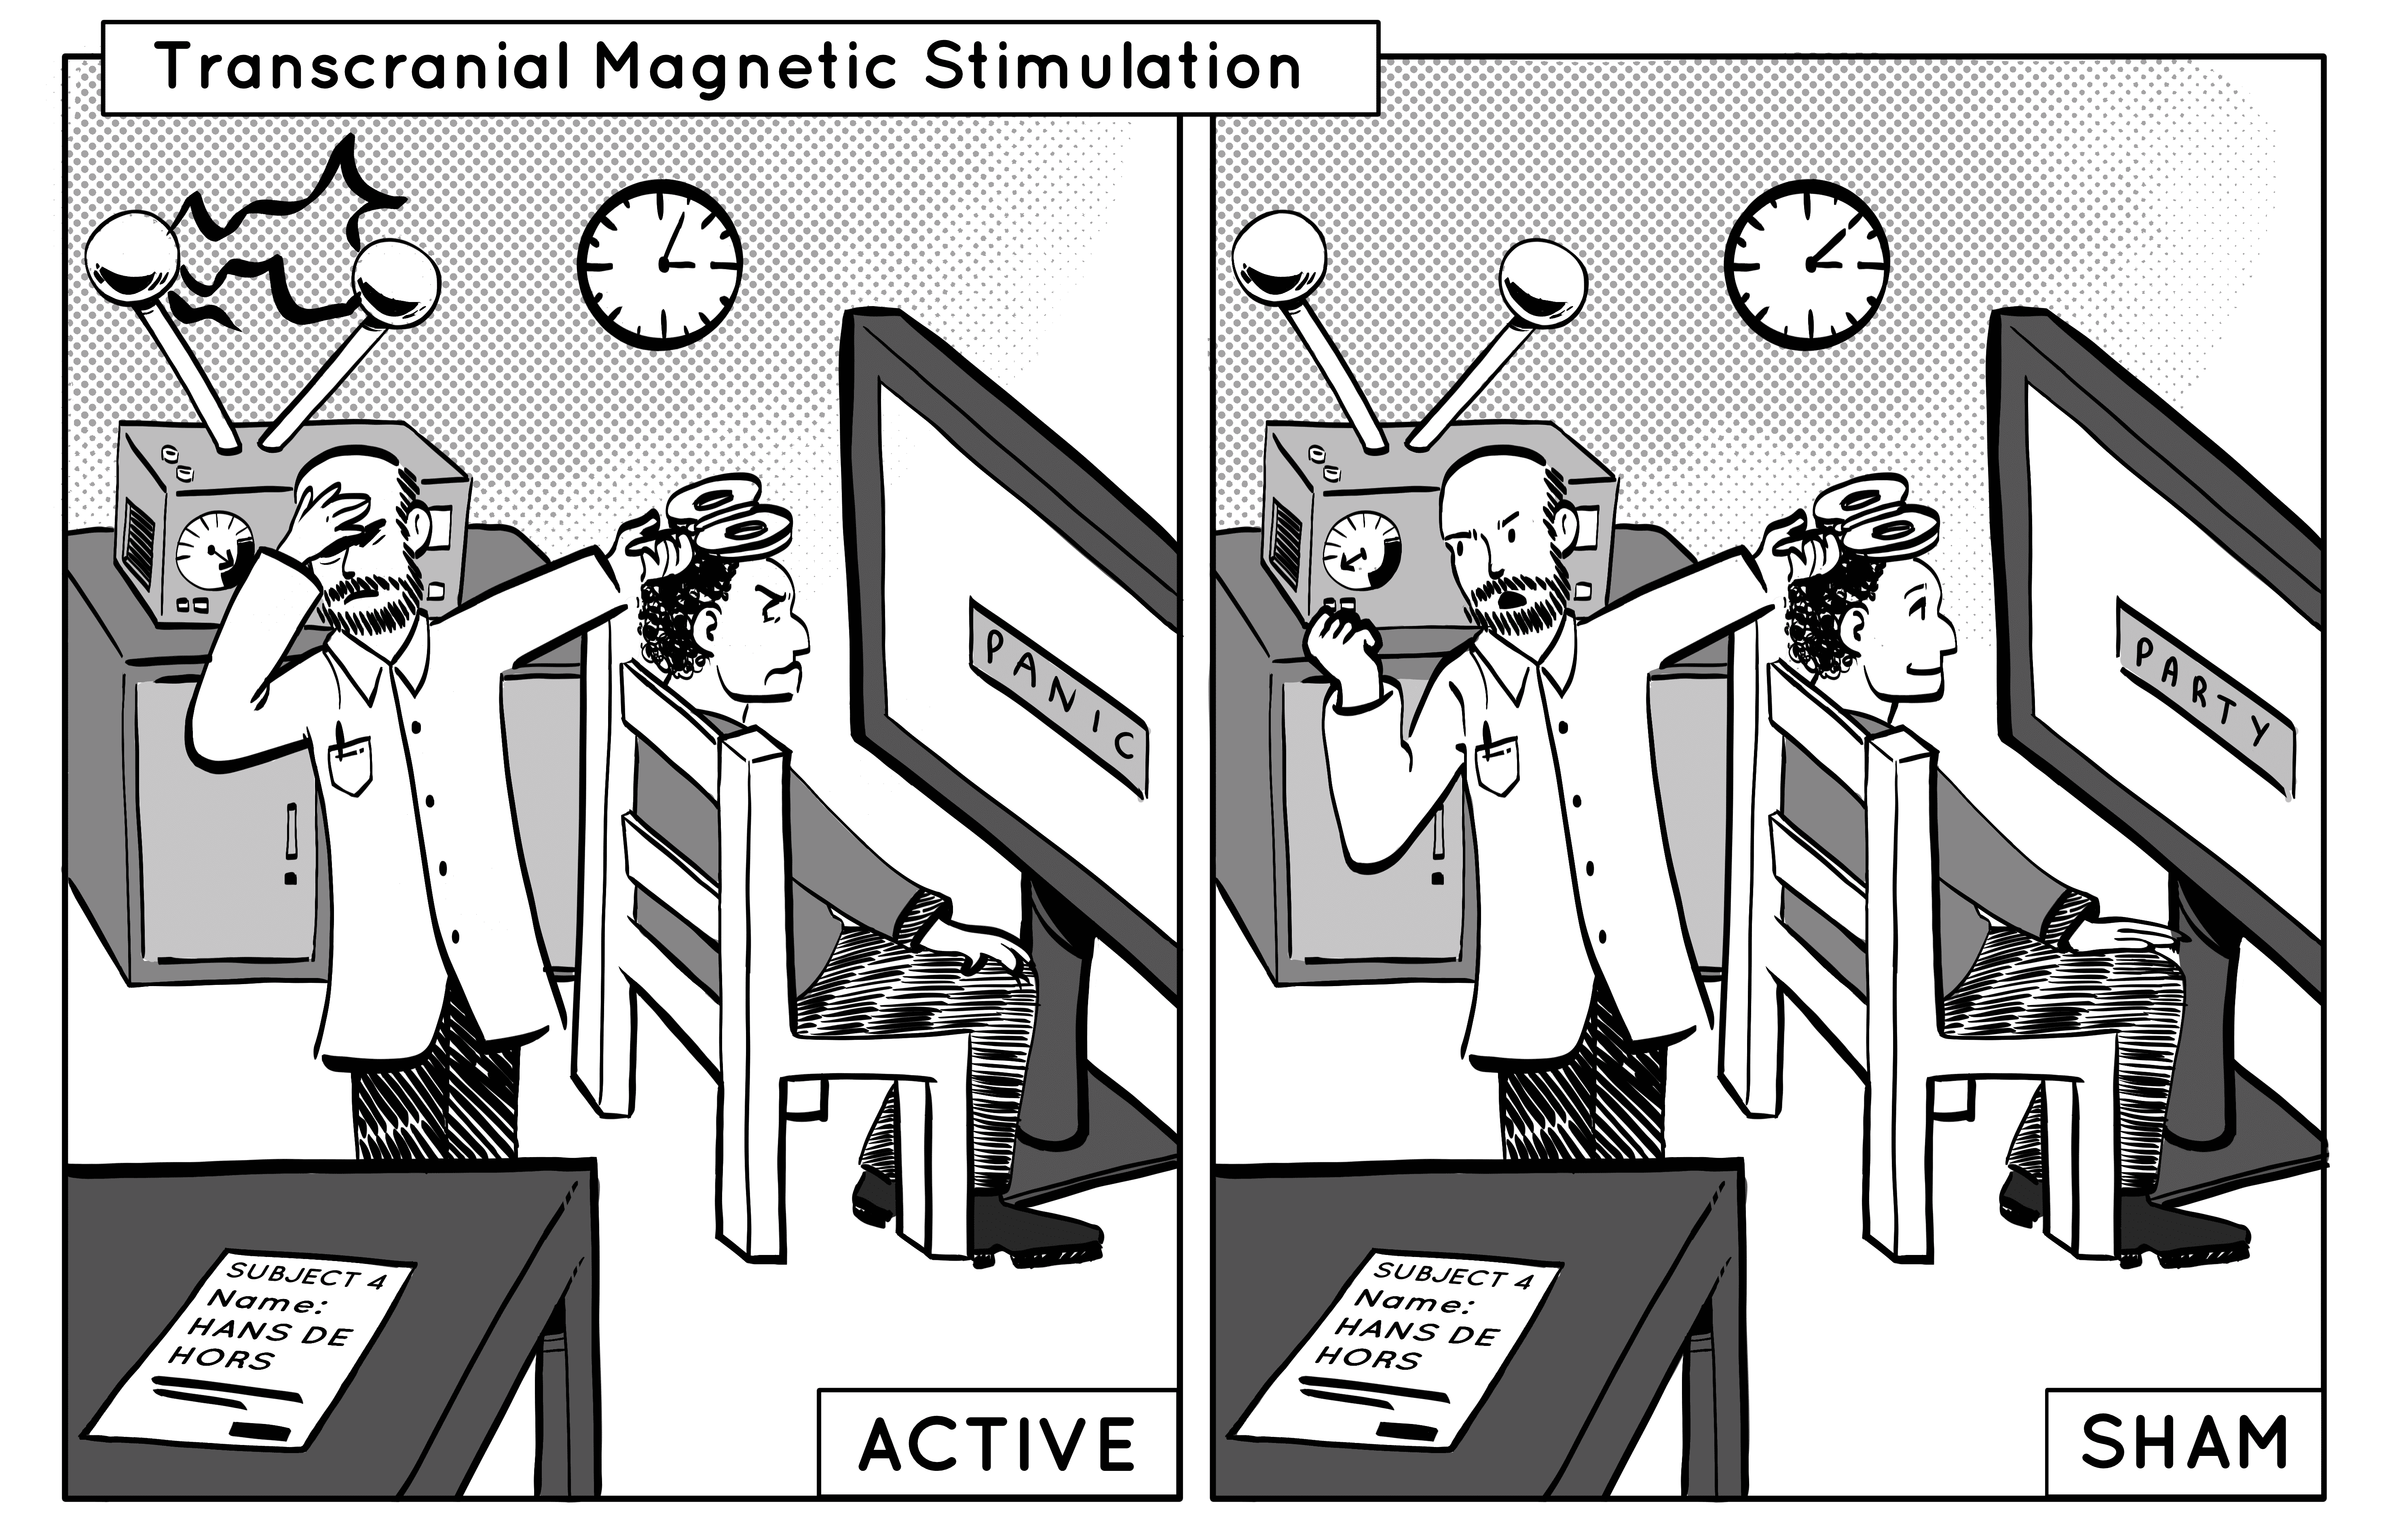
Transcranial Magnetic Stimulation (TMS) uses rapidly changing magnetic fields to temporarily alter the responsiveness of neurons in parts of the brain immediately below the stimulator, in order to see how this affects people’s perception or behaviour. For example, a short stimulation over the top of your head (specifically your “motor cortex”) can cause you to raise your arm without willing it. TMS is very useful for cognitive neuroscience because it is a step closer to testing causality, e.g., whether changing neural activity in parts of visual cortex, for example, changes what people see.
However, it is very important to compare stimulation with a “sham” condition that is matched in every way apart from magnetic stimulation (for example, by matching the “clicking” sound typically produced by the rapidly changing fields). As illustrated in the above cartoon, this might even include subtle cues from the experimenter (who might be aware of whether it is an active or sham condition), to avoid for example the famous case of “Clever Hans the Horse” – a horse who appeared to be able to perform tasks like counting, but was actually responding to unconscious cues from his trainer. One can also use repetitive TMS (rTMS), which uses sustained, sub-threshold stimulation, and might have benefits for some mental health problems such as forms of depression that are resistant to treatment (see here for further reading).
——————————
Electroencephalography (EEG)

Scientists first put electrodes on people’s heads over a hundred years ago. They recorded fluctuations in the voltage difference between electrodes that are caused by the electrical currents flowing along the dendrites (connecting fibres) of large numbers of neurons in the underlying brain. This technique of Electro-EncephaloGraphy (EEG) revealed characteristic oscillations of different frequencies, such as the “alpha” rhythm of 8-12 Hz, which varies with your drowsiness. Modern EEG systems typically use 64-128 electrodes spread over the head, recording electrical changes every millisecond (see this for further reading)
EEG has much better temporal resolution than does fMRI, because it measures neural activity directly, rather than the brain’s much more sluggish blood flow response that causes the fMRI signal (see above). EEG’s downside however is its spatial resolution, which is much poorer than fMRI, because it is difficult to know exactly where inside the brain is producing the voltage differences outside the head. This is why cognitive neuroscientists sometimes ask volunteers to perform the same tasks in fMRI and again in EEG (or MEG; see below), and combine the data to get movies of activity over the brain, benefiting from the spatial information in fMRI and the temporal information in EEG/MEG.
The amplitude of the brain oscillations detected by EEG varies when people are asked to do different things, such as counting backward in 3s in the above cartoon. However, there is often a lot of “noise” too, such as distracting thoughts. For example, the cartoon refers to the myth that men are constantly distracted by thinking about sex (every 2 seconds in the cartoon above, or 0.5Hz); see this BBC article and this scientific paper if you’re interested in whether this myth is true!
——————————
Magnetoencephalography (MEG)
Rather than using strong magnetic fields to cause molecules to resonate (as in MRI above), or using strong alternating fields to modulate neural responsiveness (as in TMS below), MagnetoEncephaloGraphy (MEG) detects tiny magnetic fields caused by neural activity. You may remember from physics that the electrical currents flowing along the dendrites mentioned in the EEG section above will also produce a magnetic field. The main advantage of MEG over EEG is that these magnetic fields are less distorted by the skull and scalp, making the underlying electrical currents easier to localise (but still with considerable uncertainty).
These magnetic fields really are really tiny. For example, the earth’s magnetic field is approximately 50 x 10-6 Tesla (micro-tesla), whereas the fields produced by neural activity are typically 200 x 10-15 Telsa (pico-tesla) – a hundred million times weaker than the earth’s magnetic field! While an MRI scanner, on the other hand, is typically 3 Telsa; or a hundred thousand times stronger than the earth’s magnetic field.
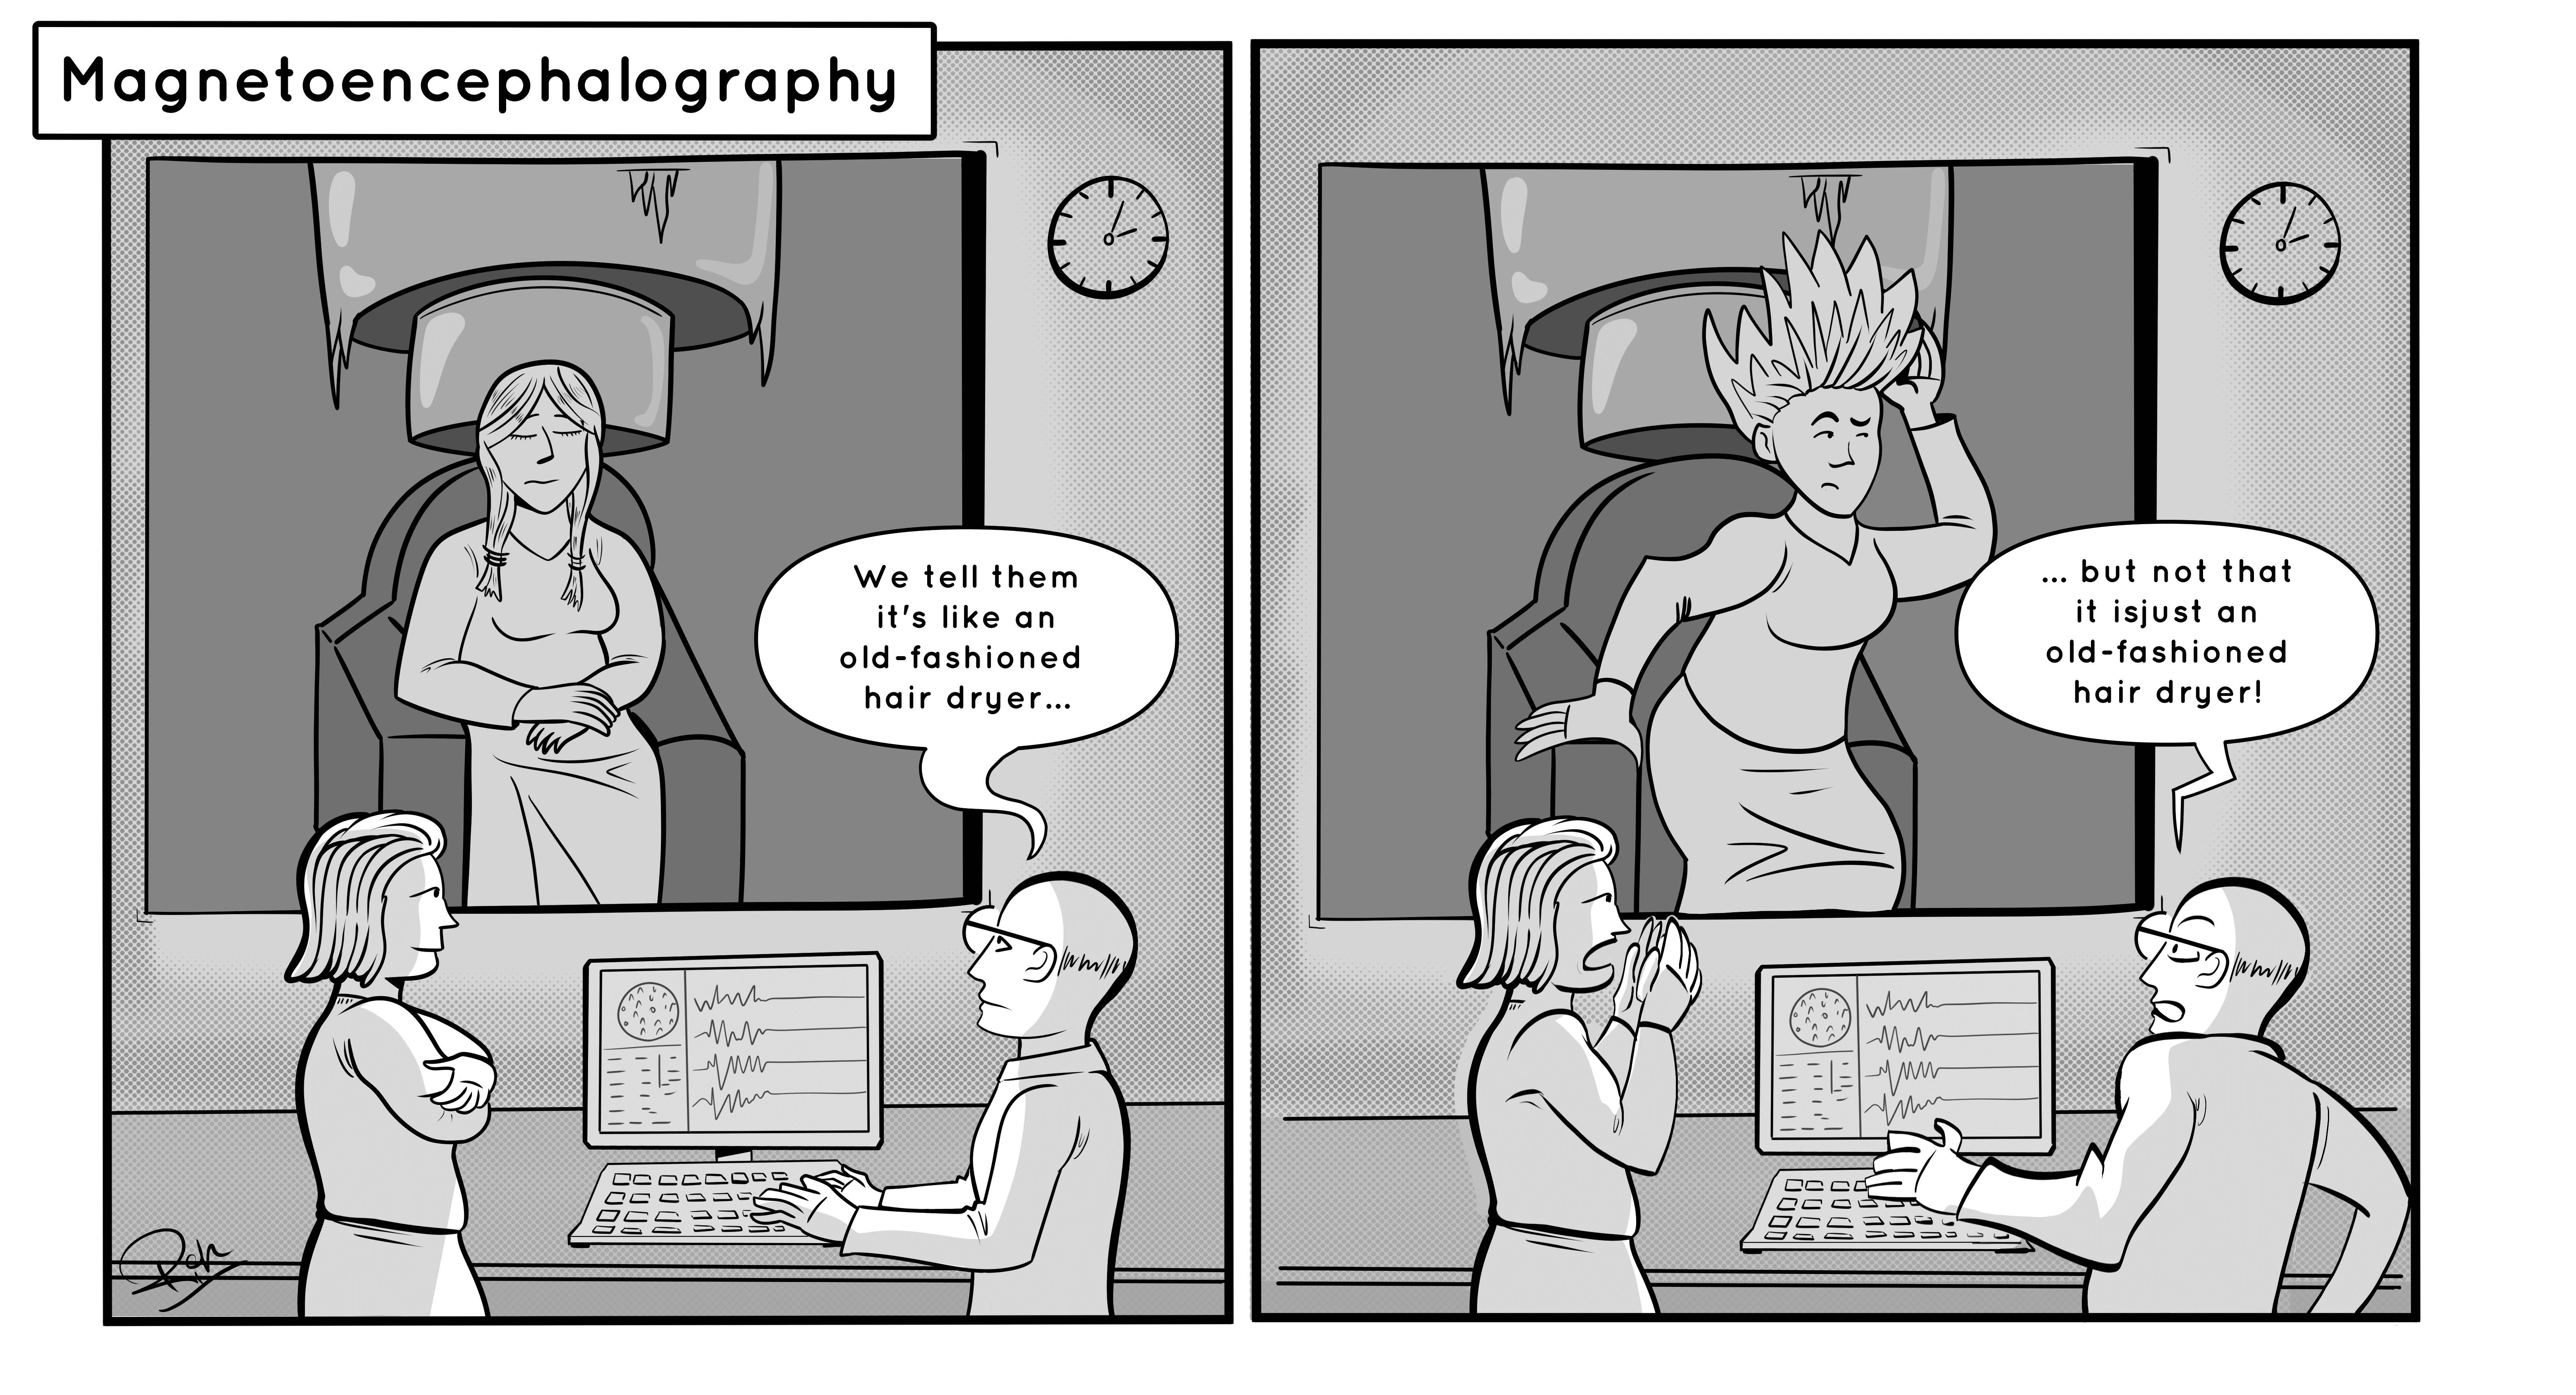
Detecting such small fields requires two things: First, that participants be in a “magnetically-shielded room”, to block the earth’s magnetic field, and secondly, the use of extremely sensitive sensors called “SQUIDS” (super-conducting quantum interference devices). Because SQUIDS only work when super-conducting, they need to be kept very cold, and current MEG machines use liquid helium, which is only liquid at -269 °C.
Participants put their head in a helmet that contains the sensors, much like a hair dryer in some salons (as shown in the cartoon above), but are not told that there are also many litres of liquid helium above them! (This is not a real concern; the machines are very safe!). Recently however there is growing use of a different type of sensor - the “OPM” (optically-pumped magnetometer) – which can operate near room temperatures, and so be attached to much more portable caps like with EEG (see this article for further reading). For more information about MEG, watch this video.
——————————
Deep Neural Networks (DNNs)
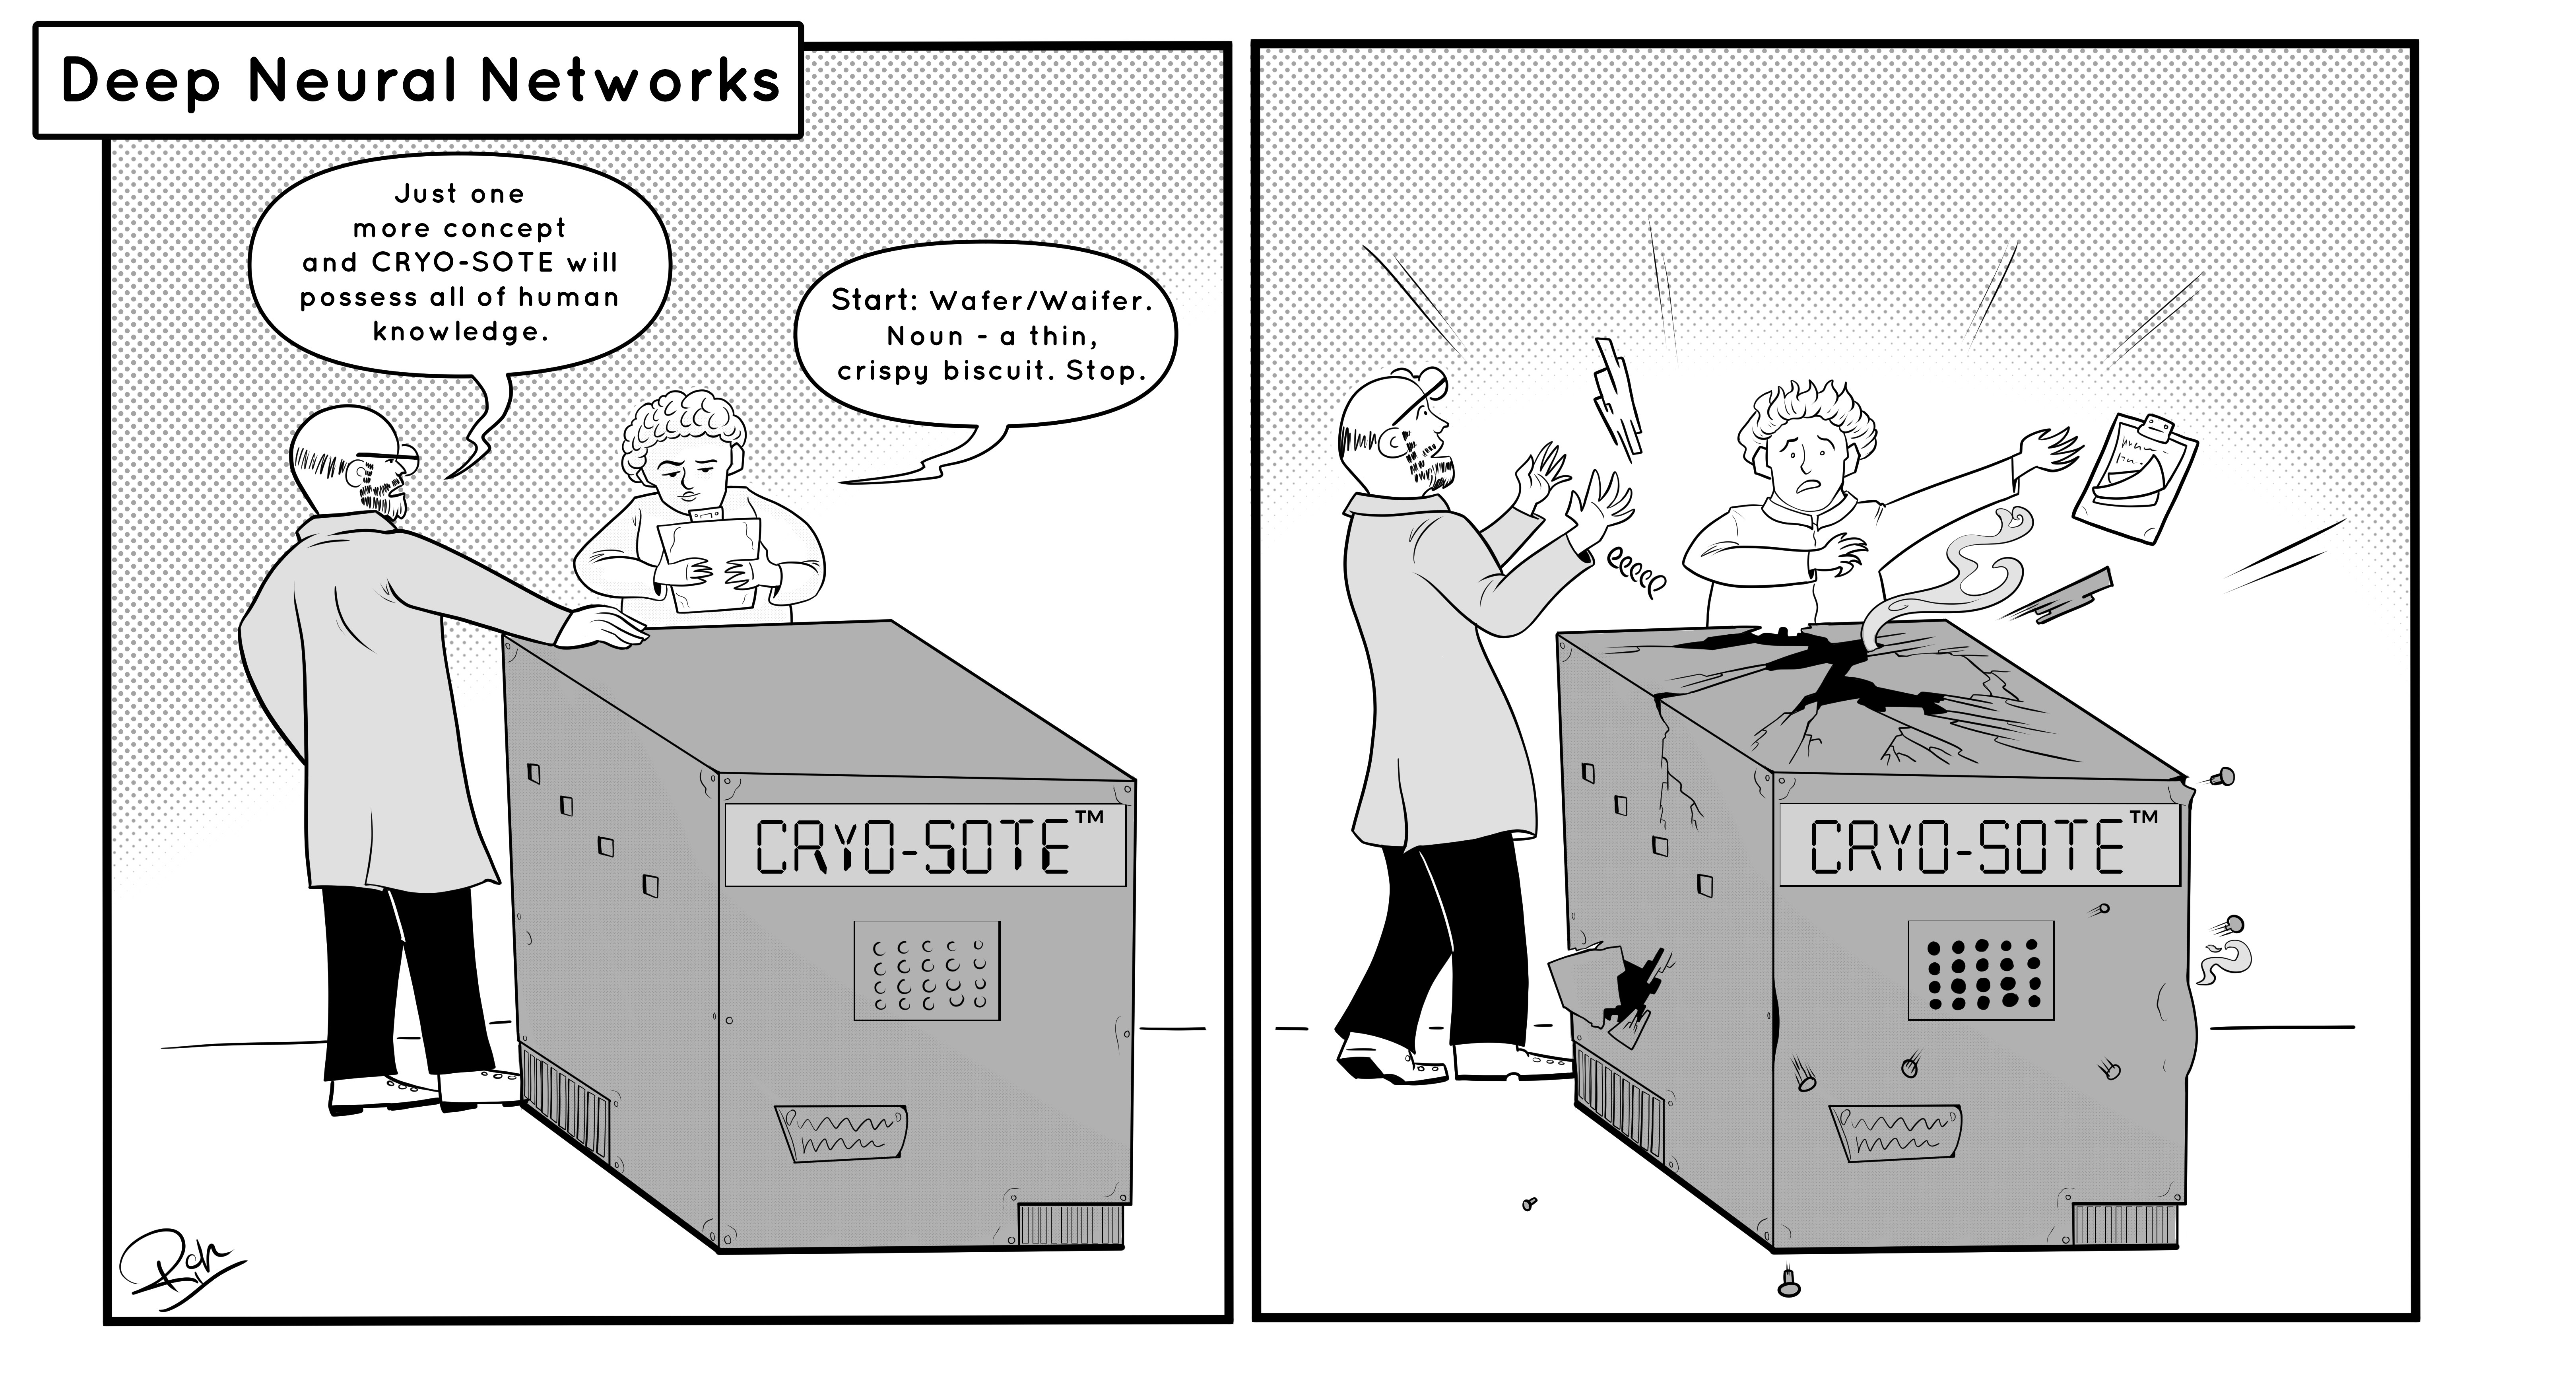
Deep Neural Networks (DNNs) are computer models that are based on the organisation of brains, by simulating a large number of units (like neurons) that are connected to many other units (like the dendrites in the brain), where the strength of those connections can change with learning (like synapses do in the brain). With advances of computing power (so they can become "deeper" with more layers), and massive datasets to learn from (e.g, from the internet), DNNs are becoming more and more powerful for uses such as recognising objects or understanding speech, like Chat-GPT. Indeed, they are the basis of most modern AI systems.
DNNs can also be used to study the human brain, by comparing the representations they learn (for example, after repeatedly being taught the name of objects shown across many pictures) to the representations seen in our brains (using fMRI or MEG), which we also learn over years of development and exposure as children (see here for further reading). Once a correspondence between the artificial and real neural representations has been established, the effects of certain manipulations – removing some units or connections, or adding noise to units – can be used to simulate effects of brain damage or diseases like Alzheimer’s in humans. It remains an open philosophical question whether DNNs will ever be the basis of machines as intelligent or knowledgeable as humans – as illustrated by the above cartoon that was inspired by “Monsieur Creosote” in Monty Python’s film “The Meaning of Life”.
——————————
Focused Ultrasound Stimulation (FUS)

One can also stimulate the brain using high-frequency sound waves (ultrasound). One advantage of this method of Focused Ultrasound Stimulation (FUS) over TMS (above) is that the ultrasound can be focused on regions deeper in the brain (without necessarily affecting intermediate brain tissue), whereas TMS cannot directly stimulate more than a few centimetres beyond the scalp. This allows neuroscientists to alter the function of important “sub-cortical” regions like the hippocampus that are close to the centre of the brain.
The precise mechanism by which ultrasound affects neural activity is not fully understood, but it is believed to affect “mechano-sensitive” ion channels, which convert mechanical vibrations from the ultrasound into electrical or chemical signals in the brain. This technology is more recent than TMS, so replicable effects on human behaviour need to be established, but it offers a lot of potential. Who knows, it might even be able to obliterate “ear worms” – those catchy but annoying tunes that sometimes get stuck in your mind!
FUS could also have clinical use, by bursting “microbubbles” within blood vessels in the brain in order to deliver a drug to a specific brain area. In principle, one could also use ultrasound to image the brain (like MRI) - similar to the sonography used on pregnant women - but the skull makes this tricky because it distorts and reflects sound waves. One related technique is Transcranial Doppler imaging, which is applied to the major arteries that feed the brain (before they disappear into the skull), in order to measure the speed and direction of blood flow.
——————————
Articles written by Dr Rik Henson and Ian Cooke-Tapia
Art by Dr Rik Henson, inked by Ian Cooke-Tapia and Alexa Erazo


